performance engineering · JVM · kuum-oss
kuum/sol.
// three-tier JVM performance testing system

Micro → Load → Chaos. A complete JVM observability pipeline:
JMH microbenchmarks with CI regression gate,  five Gatling load profiles with InfluxDB export,  and automated chaos engineering via Toxiproxy, Chaos Monkey, and Resilience4j.
"Every benchmark is a lie — until you run it under real load and inject a failure."
0tier
testing layers
0×
Gatling profiles
0×
chaos scenarios
0KO
smoke test · 25 req/s
01 system architecture
TIER I · MICRO
JMH Benchmarks
Java Microbenchmark Harness
  • Jackson / Gson / kotlinx serialization
  • Business logic (sort, search, compute)
  • Cache latency (hit / miss / eviction)
  • OkHttp baseline throughput
  • CI regression gate <10% drop → FAIL
  • JSON artifact upload to GitHub Actions
I
TIER II · LOAD
Gatling Scenarios
Load Testing · 5 Profiles
  • Smoke — 2 users · sanity
  • Load — steady-state throughput
  • Stress — ramp to saturation
  • Soak — 30 min stability
  • Spike — instant burst
  • InfluxDB time-series export
II
TIER III · CHAOS
Chaos Engineering
Toxiproxy · Chaos Monkey · Resilience4j
  • DB latency injection
  • Cache blackout + fallback
  • Downstream HTTP delay
  • Heap pressure / GC stress
  • Pod kill / shutdown validation
III
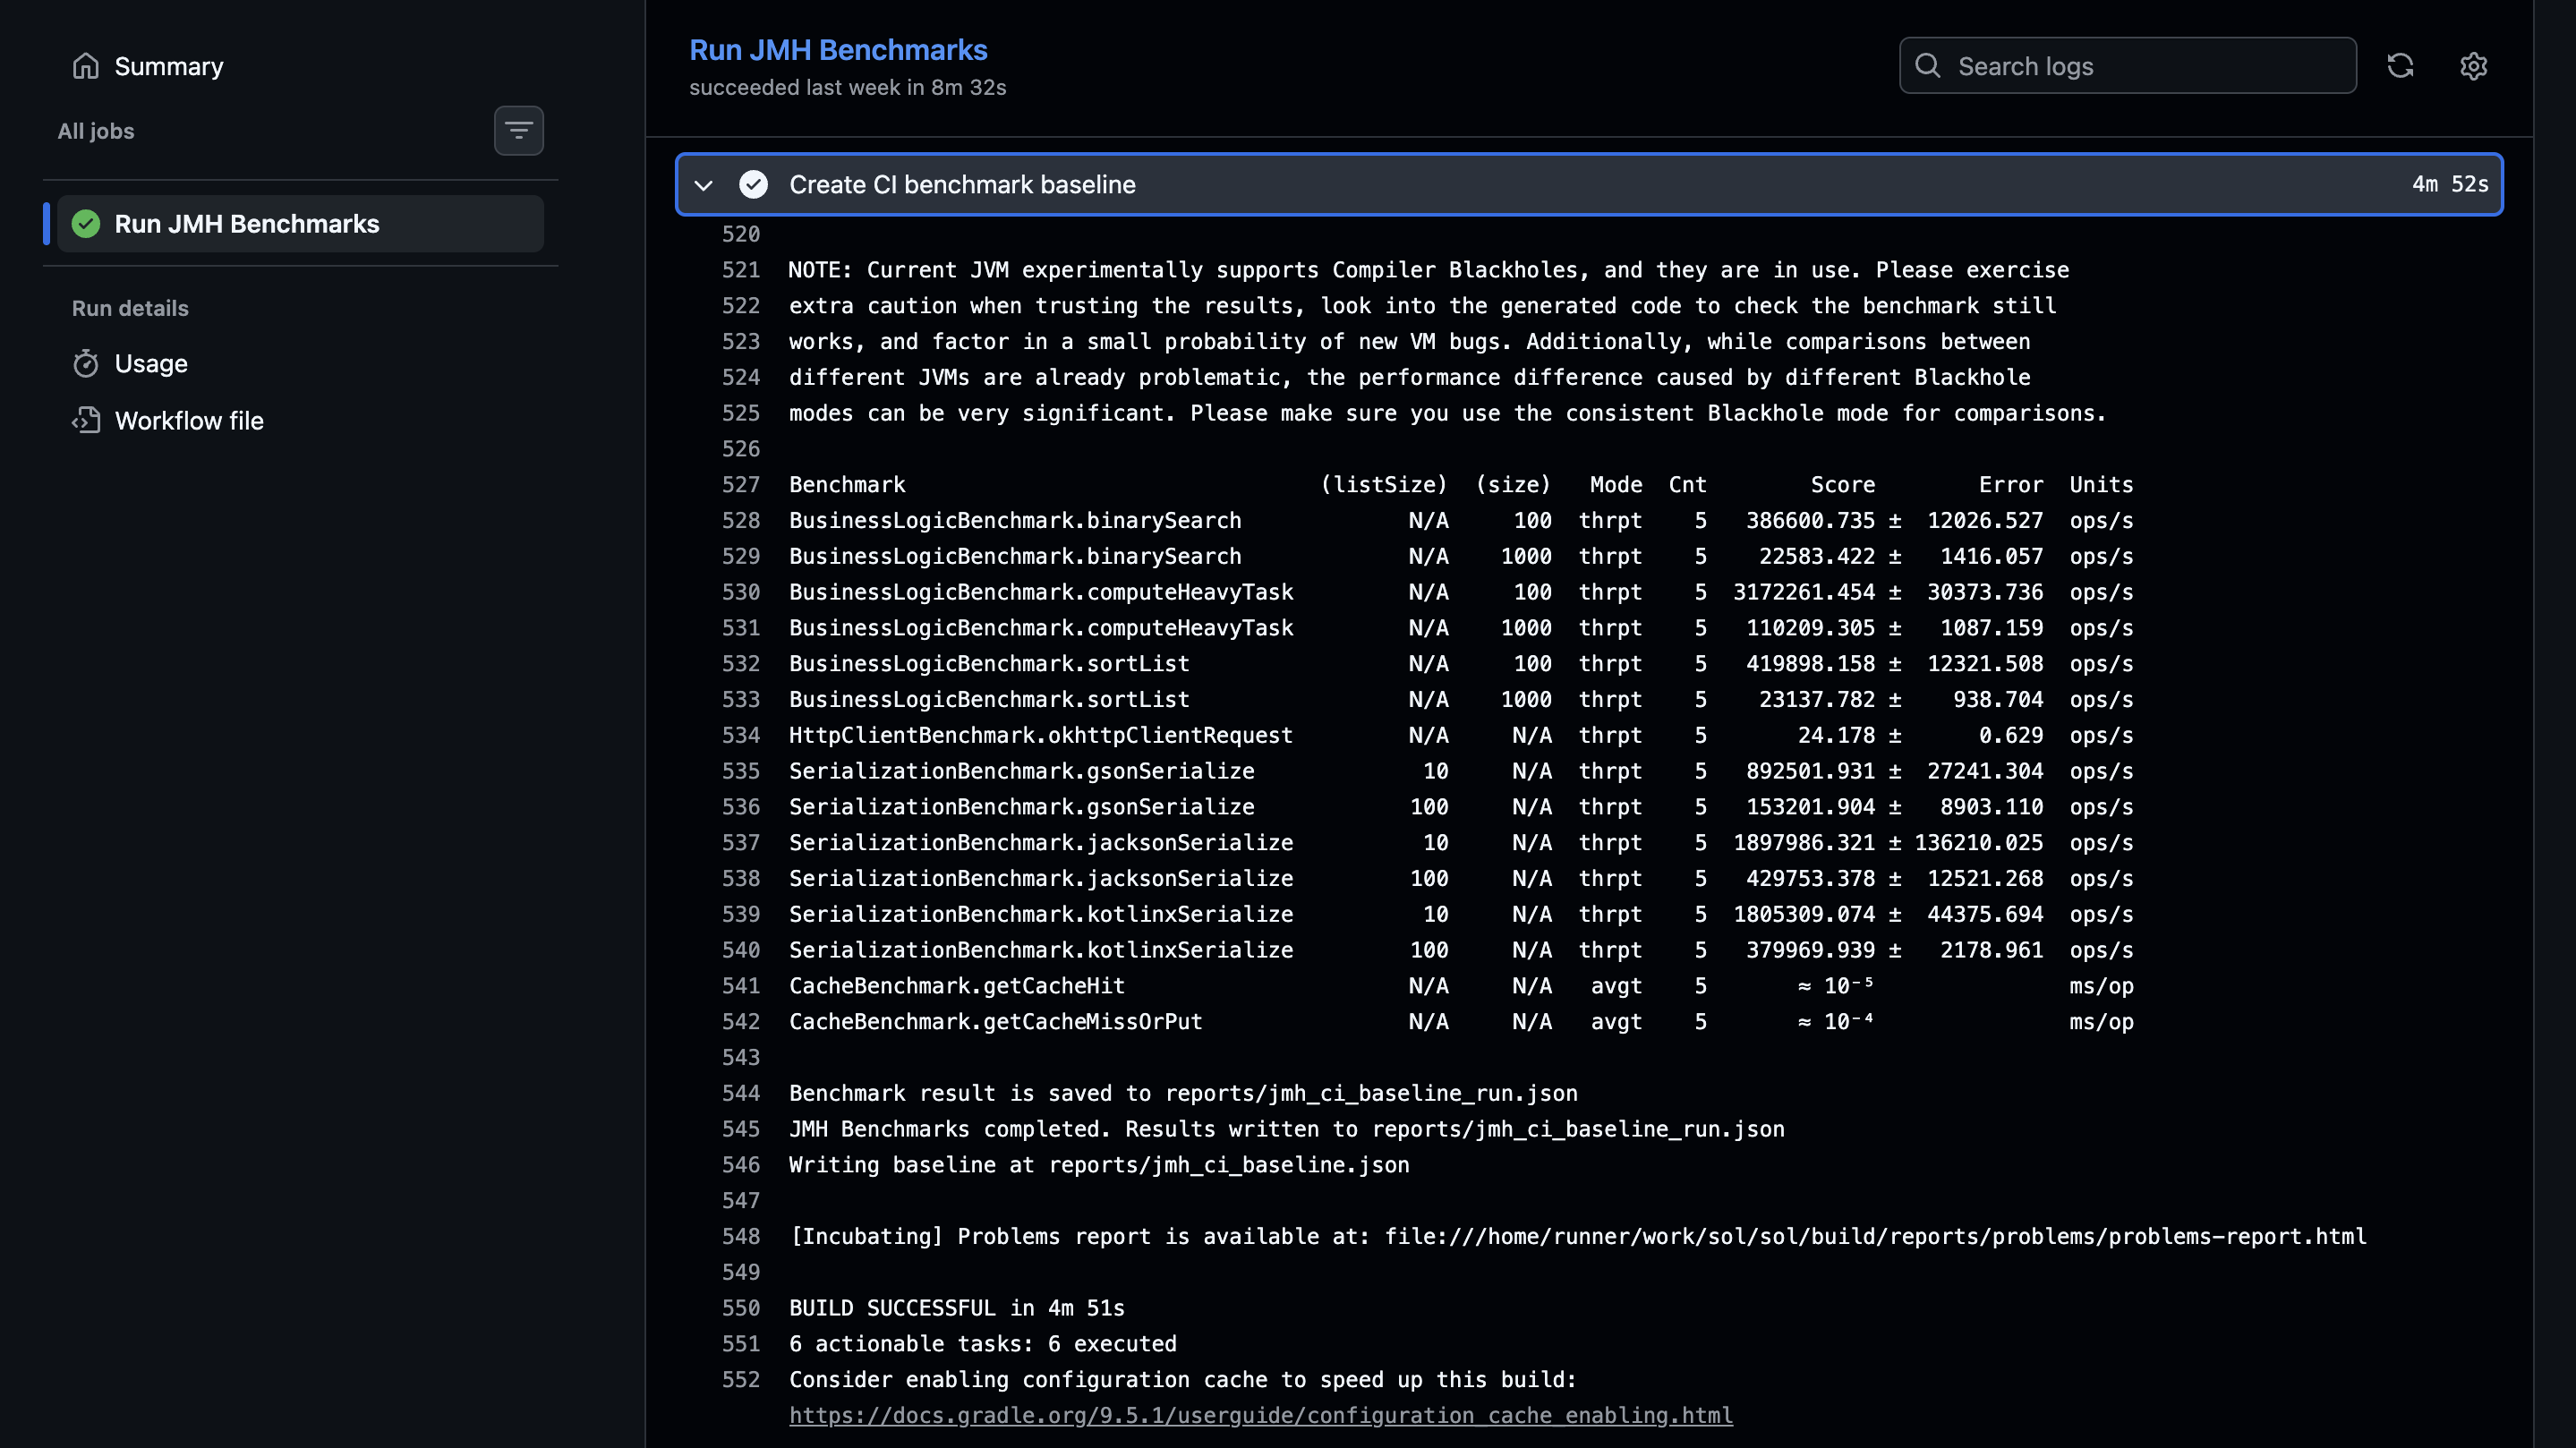
02 test evidence
03 benchmark numbers
serialization · thrpt · ops/s · 5 forks · warmup 5
benchmark param result bar vs baseline
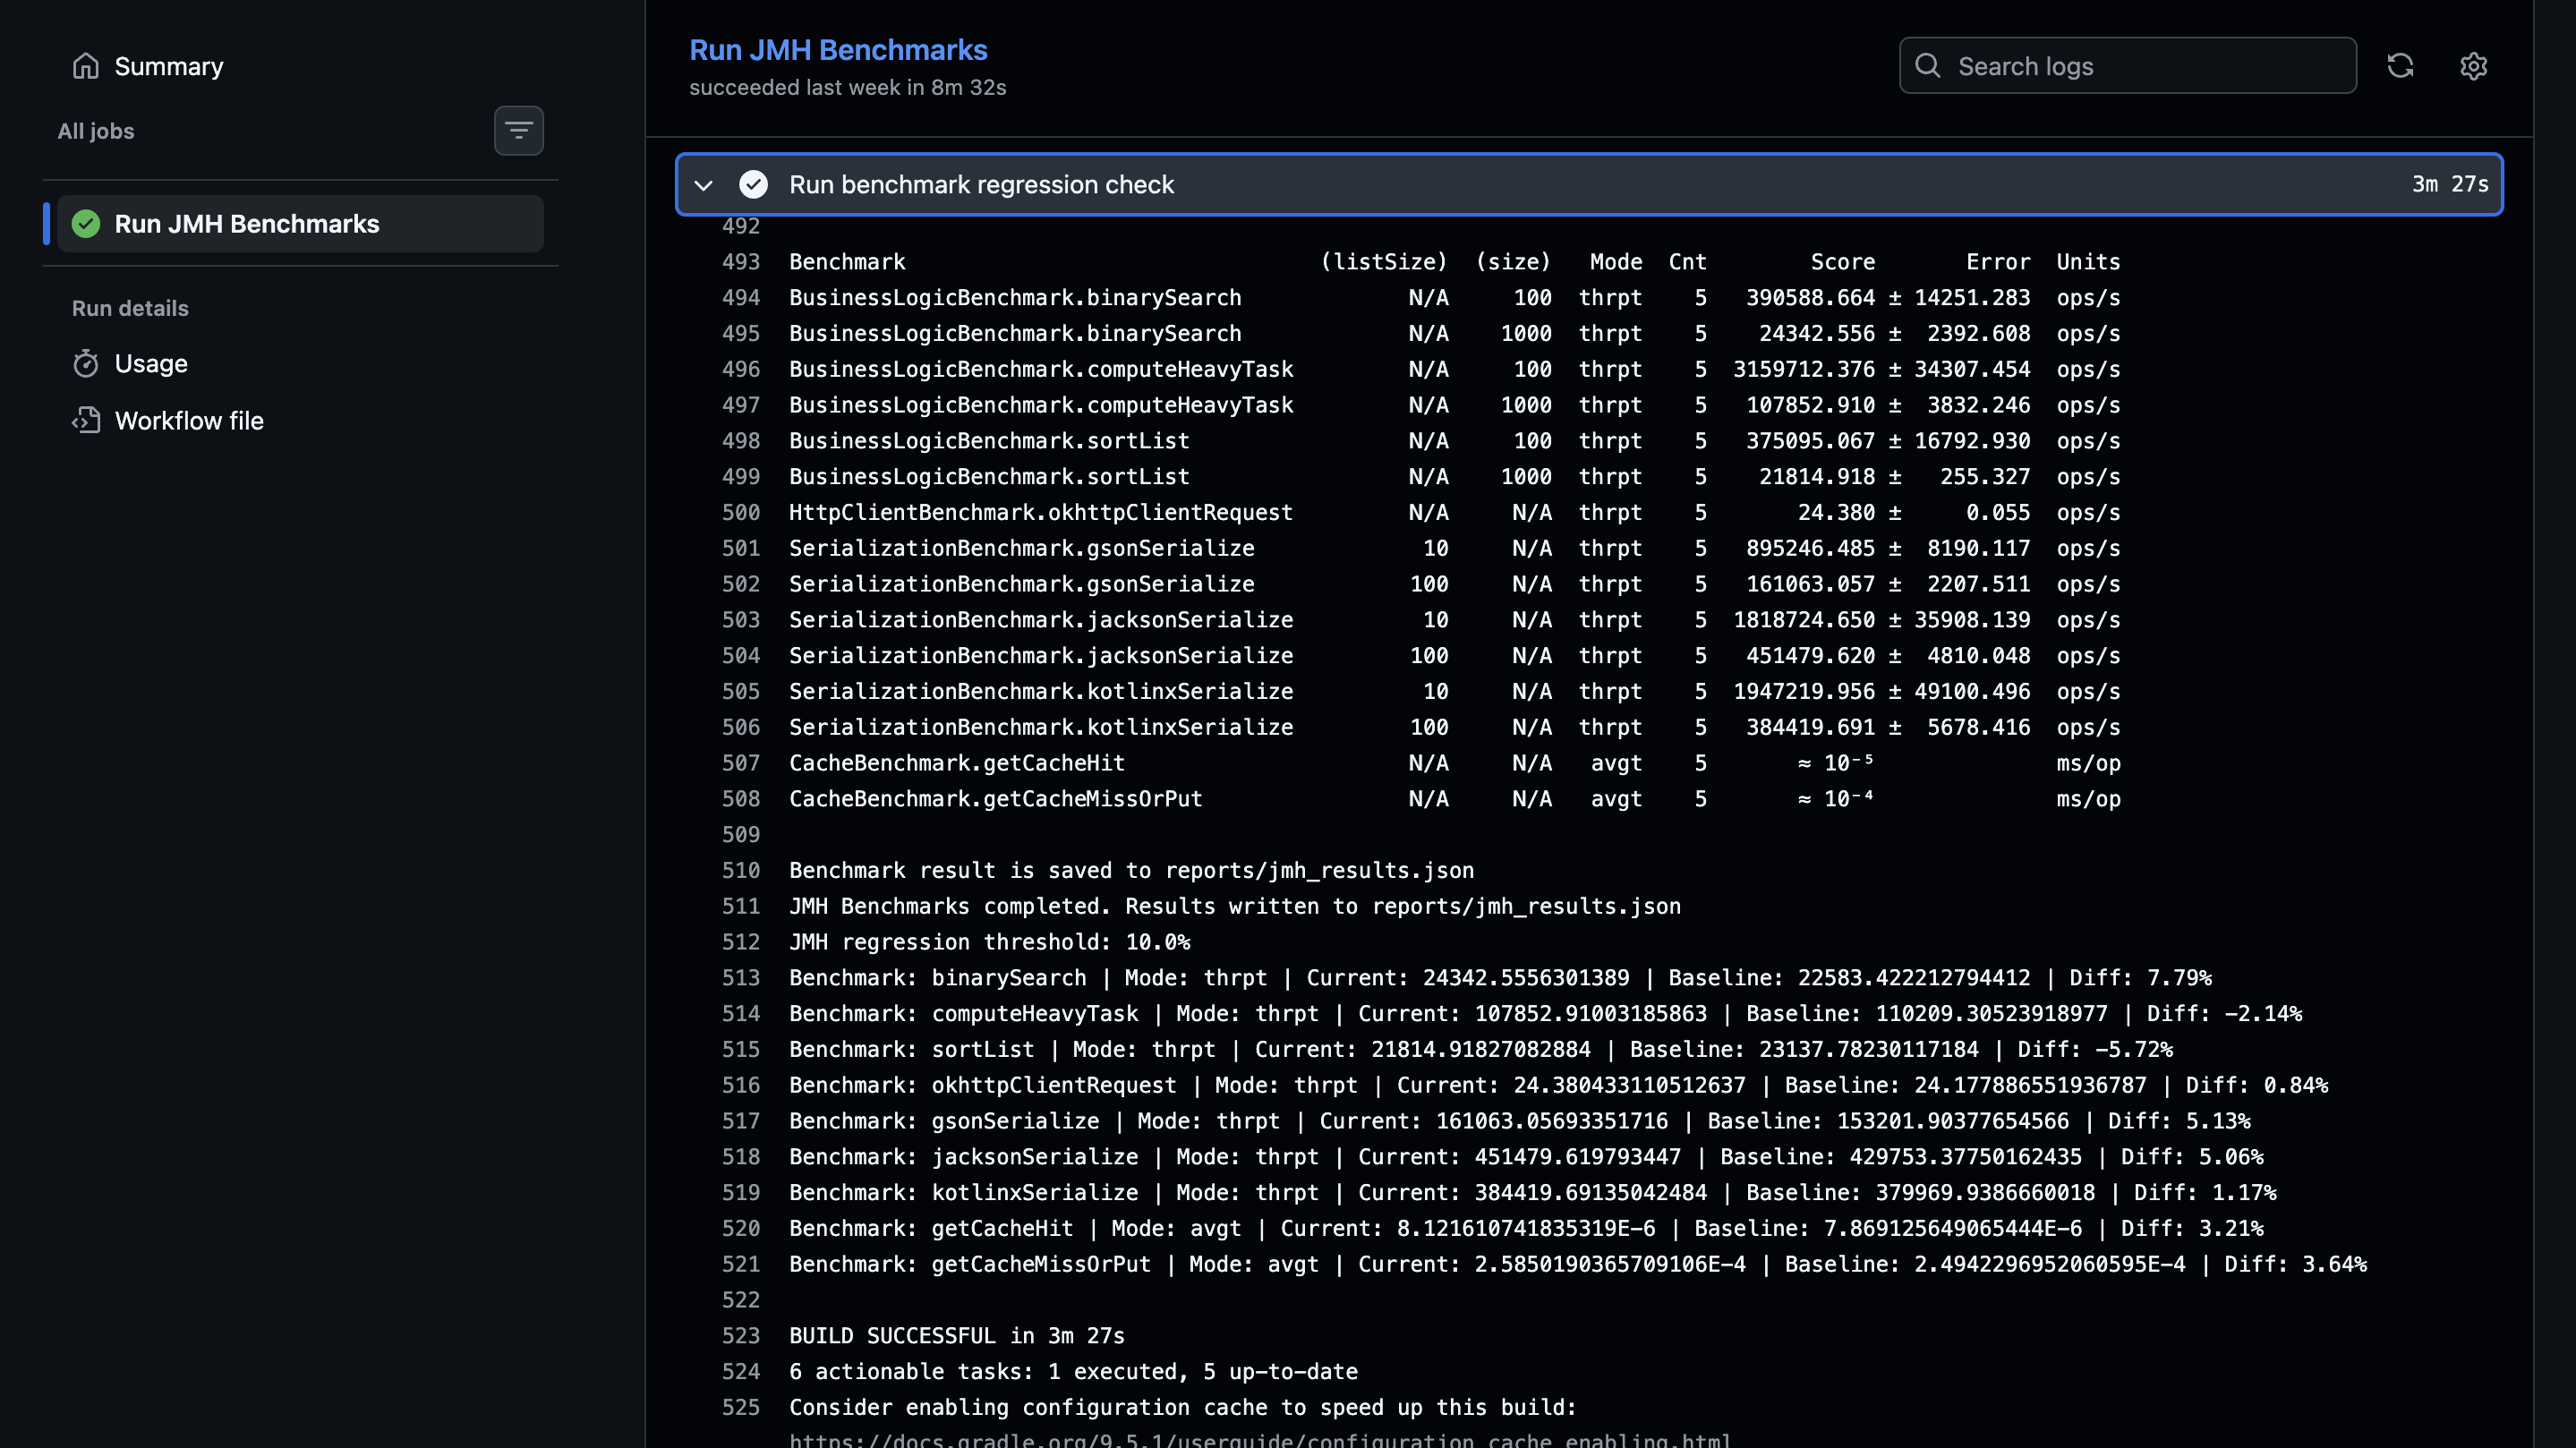
jacksonSerialize 10 items 1,897,986 ops/s
↑ +5.06%
kotlinxSerialize 10 items 1,805,309 ops/s
↑ +1.17%
gsonSerialize 10 items 892,501 ops/s
↑ +5.13%
jacksonSerialize 100 items 429,753 ops/s
↑ +5.06%
kotlinxSerialize 100 items 379,969 ops/s
↑ +1.17%
computeHeavyTask 100 items 3,172,261 ops/s
↓ −2.14%
sortList 100 items 419,898 ops/s
↓ −5.72%
binarySearch 1000 items 24,342 ops/s
↑ +7.79%
getCacheHit avgt ≈ 10⁻⁵ ms/op
↑ +3.21%
okhttpClientRequest 24.38 ops/s
↑ +0.84%
25
req / sec · smoke
5
active users
0
KO (failed requests)
04 tech stack
core
Kotlin Java 21 JMH Gatling Spring Boot Resilience4j Gradle
chaos
Toxiproxy Chaos Monkey PostgreSQL Redis OkHttp
observability
Prometheus Grafana InfluxDB Spring Actuator Docker Compose GitHub Actions
05 observability pipeline
docker compose · full stack
06 quick start
STEP 1 · CLONE
Setup
Java 21 · Gradle · Docker
  • git clone kuum-oss/sol
  • docker compose up -d
  • 7 containers start automatically
  • Grafana → :3000 · Prometheus → :9090
1
STEP 2 · BENCHMARKS
JMH · Tier I
creates local baseline automatically
  • ./gradlew :performance-tests:benchmarks:runBenchmarks
  • results → reports/jmh_results.json
  • regression vs baseline printed inline
  • threshold: 10% drop → build fails
2
STEP 3 · LOAD + CHAOS
Gatling · Chaos · Tier II–III
target-app managed automatically
  • ./gradlew :performance-tests:load-tests:runLoadTest -Dprofile=smoke
  • app boots via bootJar — no manual start needed
  • profiles: smoke / load / stress / soak / spike
  • ./gradlew :performance-tests:chaos-tests:test
3
terminal · full run sequence
$ git clone https://github.com/kuum-oss/sol && cd sol
$ cd performance-tests/infra
$ docker compose up -d
[+] Running 7/7 — postgres · redis · toxiproxy · influxdb · prometheus · grafana · sol-app
 
# Tier I — JMH microbenchmarks
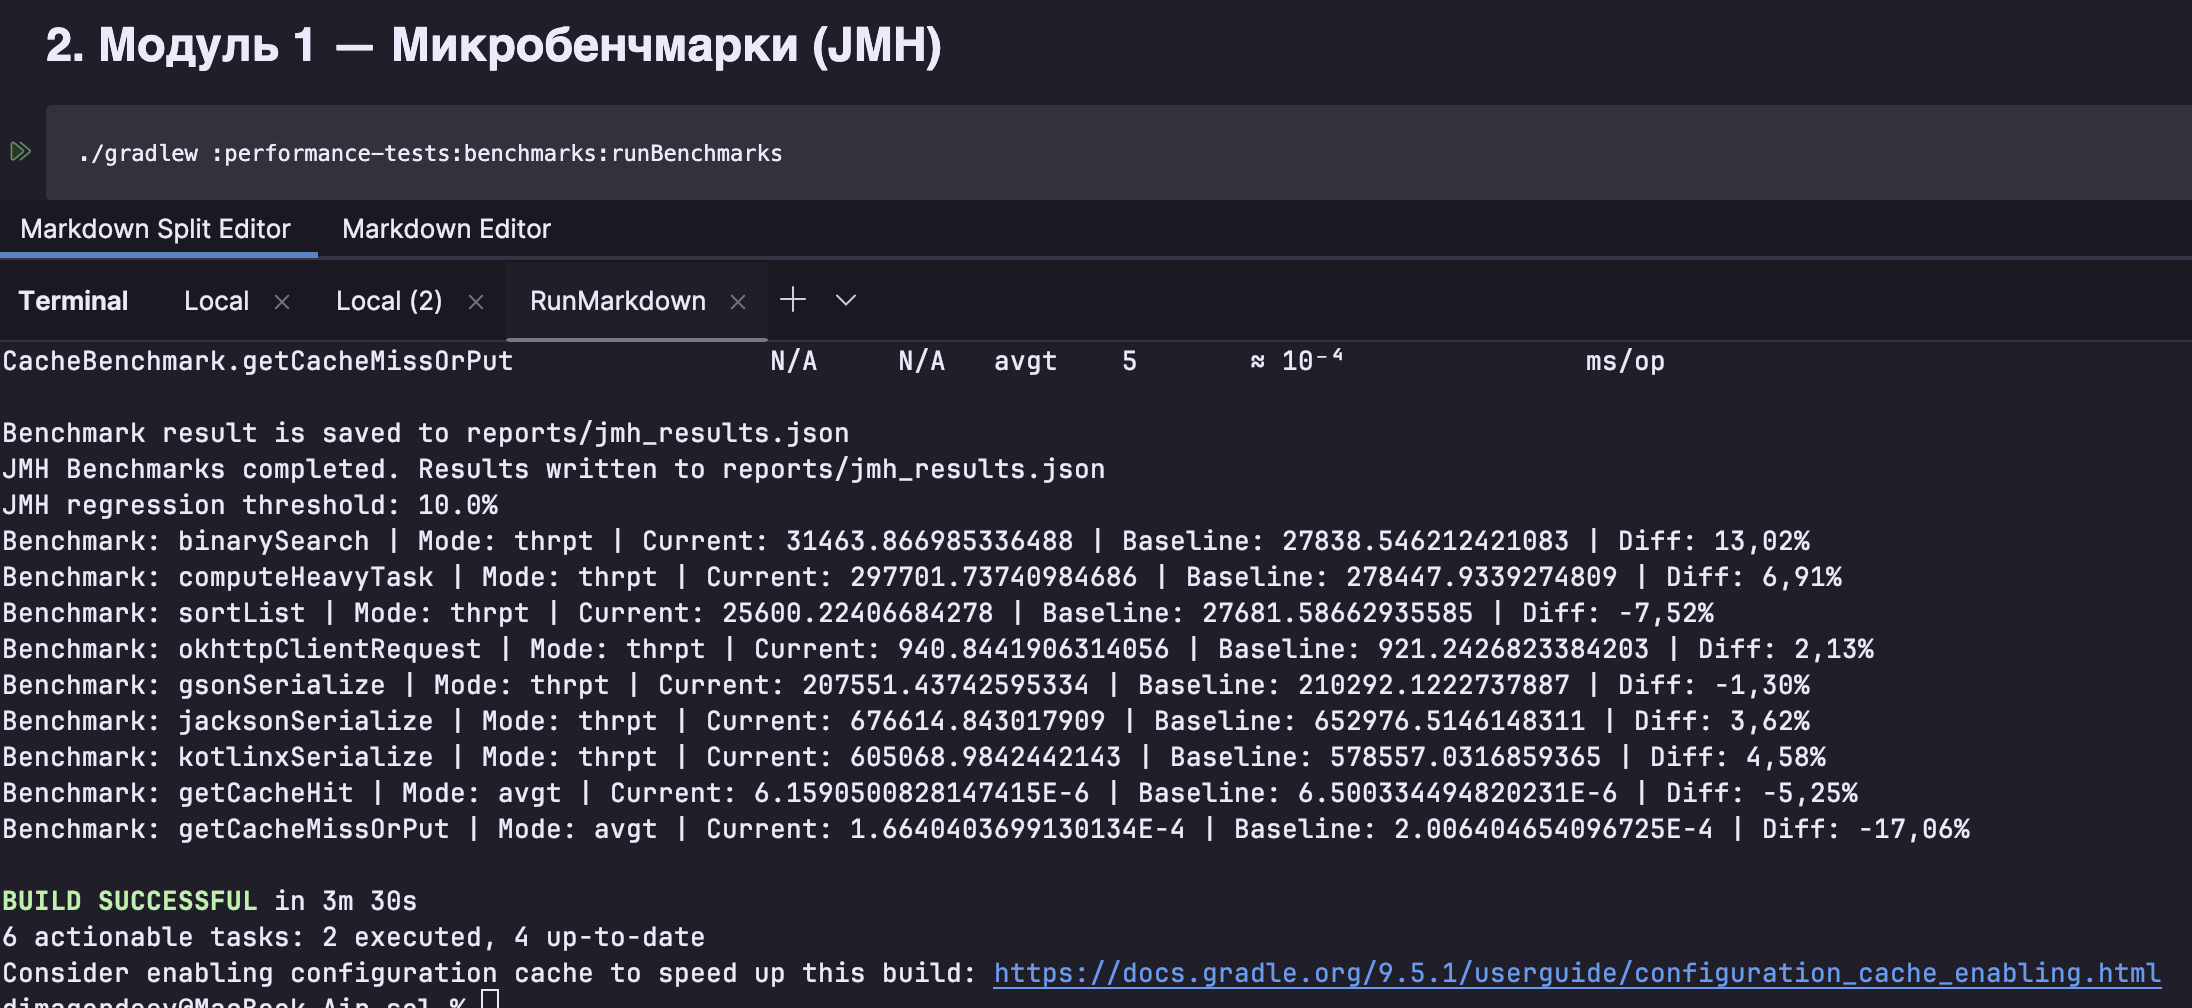
$ ./gradlew :performance-tests:benchmarks:runBenchmarks
BUILD SUCCESSFUL in 3m 30s
 
# Tier II — Gatling load test (app starts/stops automatically)
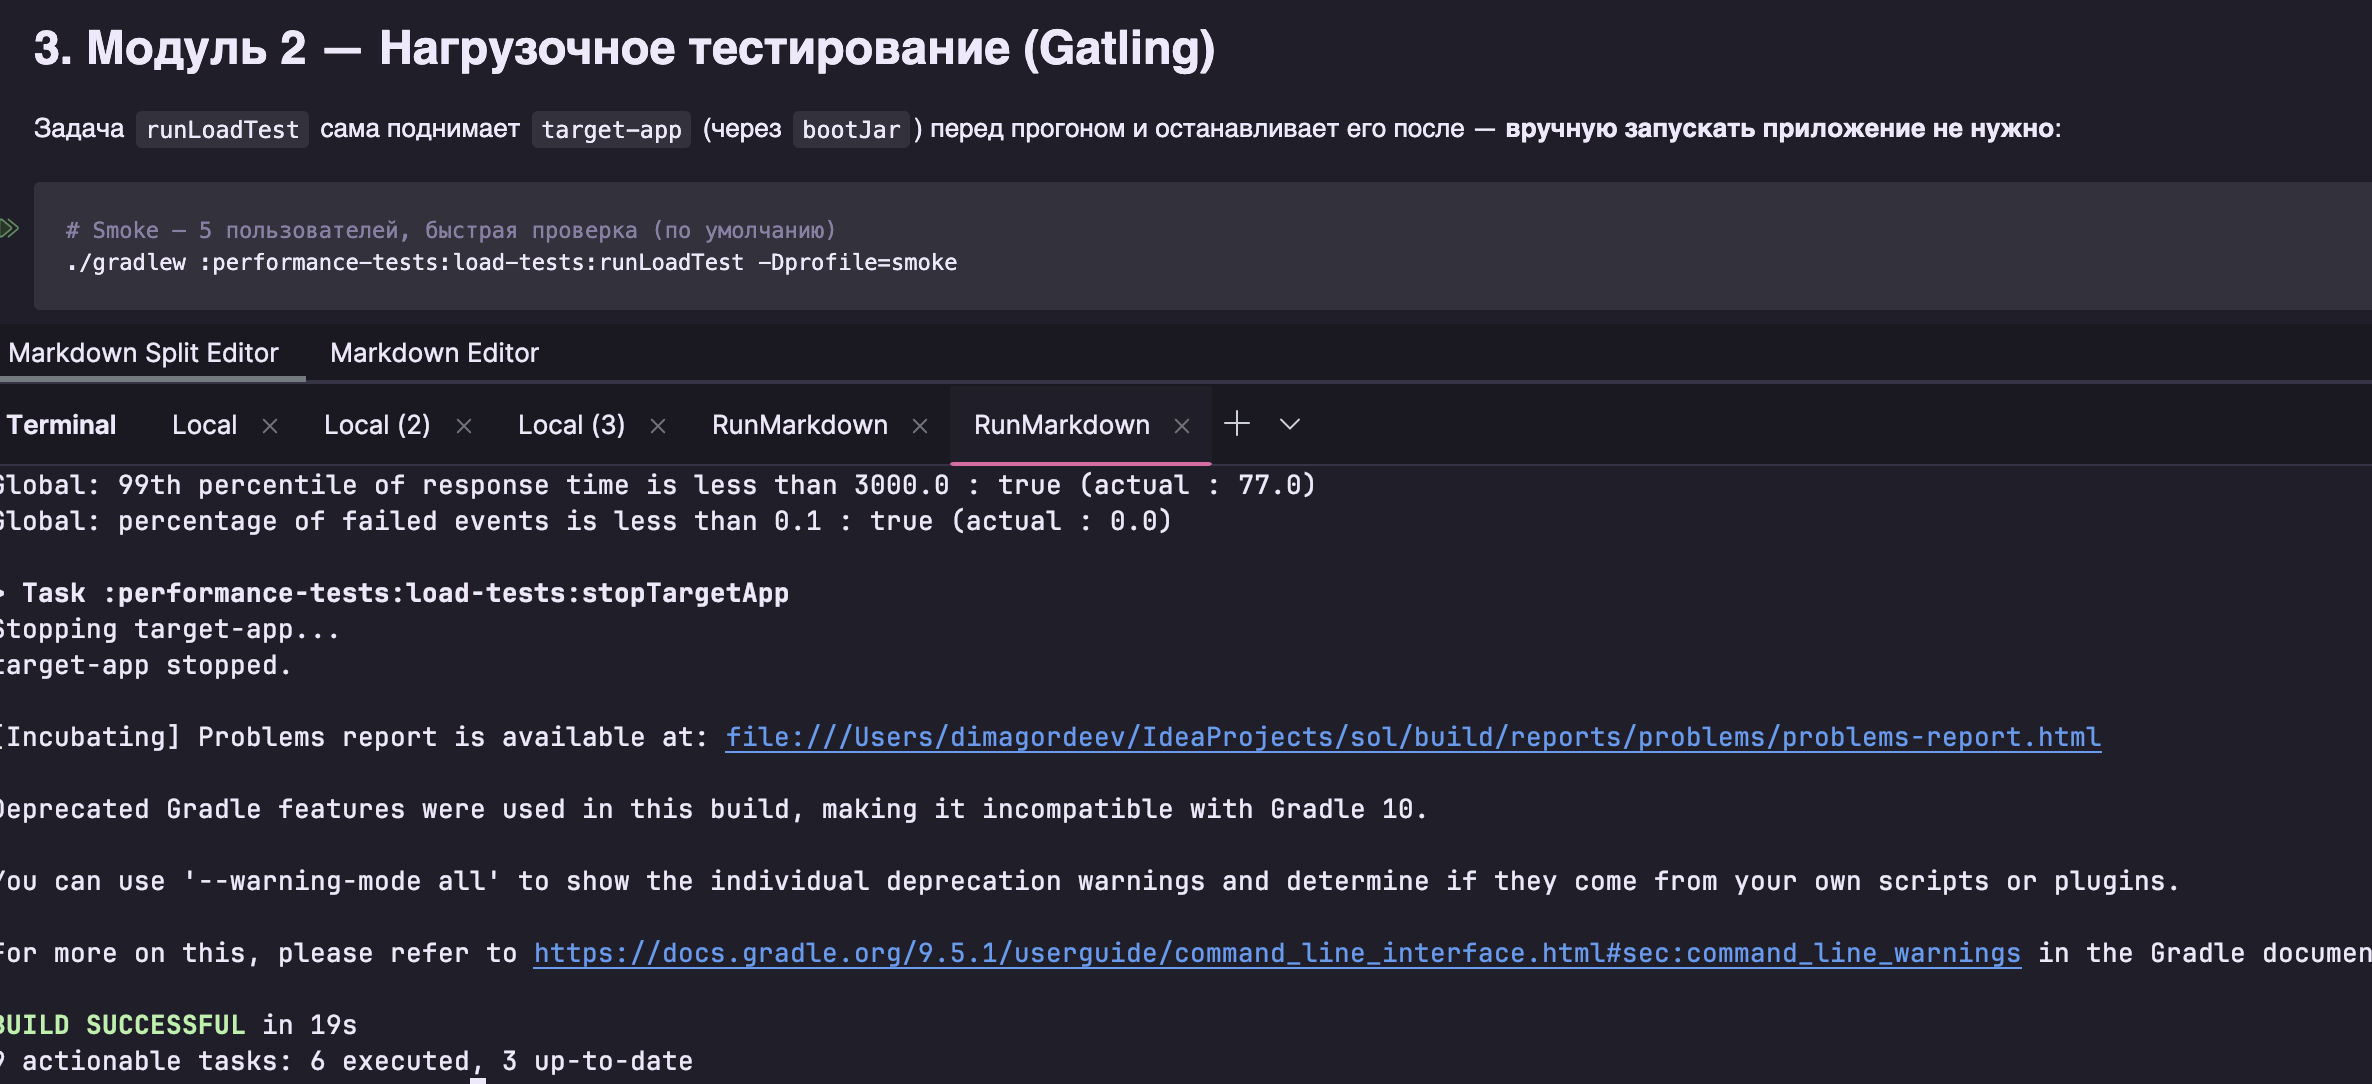
$ ./gradlew :performance-tests:load-tests:runLoadTest -Dprofile=smoke
Global: 99th percentile < 3000ms · 0.0% KO — BUILD SUCCESSFUL in 19s
 
# Tier III — Chaos engineering
$ ./gradlew :performance-tests:chaos-tests:test
BUILD SUCCESSFUL in 43s · Graceful shutdown complete
$
07 chaos results
chaos scenarios · verified results
scenario tool fault injected expected behaviour result
DB latency injection Toxiproxy +300ms on postgres:5432 Resilience4j timeout → fallback ✓ PASS
Cache blackout Toxiproxy Redis:6379 connection cut Circuit breaker OPEN → in-memory fallback ✓ PASS
Downstream HTTP delay Toxiproxy OkHttp target +500ms Bulkhead isolates · retry policy fires ✓ PASS
Heap pressure / GC stress Chaos Monkey Memory watcher assault GC reclaims · latency spike < SLA ✓ PASS
Pod kill / shutdown Chaos Monkey Random instance kill Tomcat GracefulShutdown · 0 lost requests ✓ PASS
5
chaos scenarios
5
passed
43s
total run time
0
lost requests
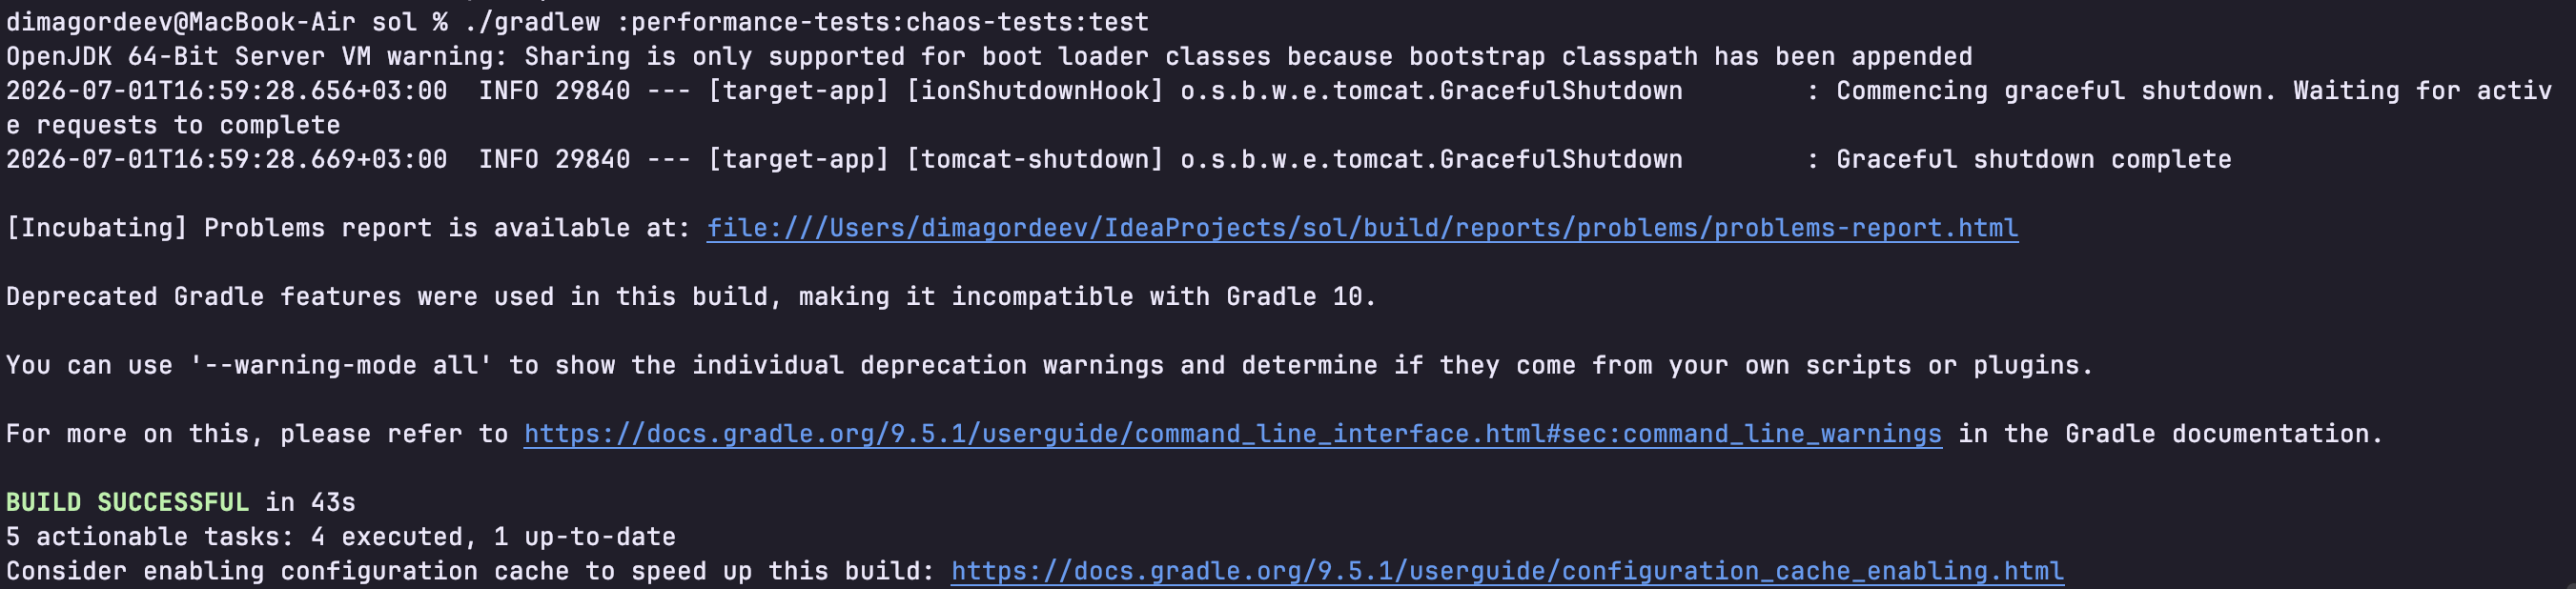
./gradlew :performance-tests:chaos-tests:test · actual output
OpenJDK 64-Bit Server VM — Sharing boot loader classes
2026-07-01T16:59:28 INFO [target-app] [ionShutdownHook]
    o.s.b.w.e.tomcat.GracefulShutdown : Commencing graceful shutdown. Waiting for active requests...
2026-07-01T16:59:28 INFO [target-app] [tomcat-shutdown]
    o.s.b.w.e.tomcat.GracefulShutdown : Graceful shutdown complete
 
BUILD SUCCESSFUL in 43s
5 actionable tasks: 4 executed, 1 up-to-date
$